Here’s my interview with Jason Marsh, CEO and Founder of Flow Immersive, that was conducted on Wednesday, October 16, 2019 at Virtual Reality Strategy Conference in San Francisco, CA. This is part 2 of 3 of my conversations with Marsh, you can see part 1 from 2018 here and part 3 from 2025 here. See more context in the rough transcript below.
This is a listener-supported podcast through the Voices of VR Patreon.
Music: Fatality
Podcast: Play in new window | Download
Rough Transcript
[00:00:05.458] Kent Bye: The Voices of VR Podcast. Hello, my name is Kent Bye, and welcome to the Voices of VR Podcast. It's a podcast about the structures and forms of immersive storytelling and the future of spatial computing. You can support the podcast at patreon.com slash voicesofvr. So continuing my series of looking at AWE past and present, today's episode is part two of three of my conversation with Jason Marsh, the CEO and founder of Flow Immersive. So this conversation takes us back to October 16th, 2019, exactly a year after I recorded the first conversation with Jason. And this is also five days after I had come home from Magic Leap LeapCon. Magic Leap and augmented reality was hot on everybody's mind. So this was kind of the latest of data stories and kind of like the next chapter of Jason's journey into working with immersive technologies and data visualization. So we're covering all that and more on today's episode of the Voices of VR podcast. So this interview with Jason happened on Wednesday, October 16th, 2019 at the Virtual Reality Strategy Conference in San Francisco, California. So with that, let's go ahead and dive right in.
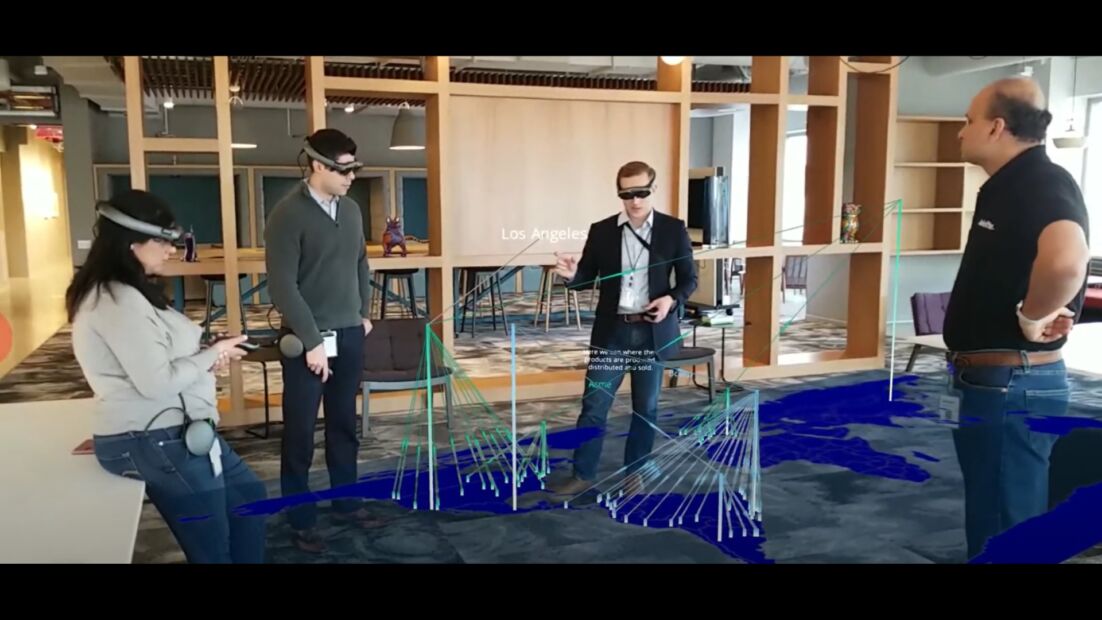
[00:01:12.481] Jason Marsh: Hi, I'm Jason Marsh, and I'm the CEO and founder of Flow Immersive, and we are focused on data storytelling. And what I like to say is that we are a communication company, and spatial computing is one of the most profound ways to communicate. but really the use case is how in the enterprise do we communicate more effectively? Specifically for us, that means data storytelling. So if you think about this situation we have today where you've got tools like Tableau, where people are doing a lot of data analysis, and there's a certain class of people doing that. Analysts, scientists, some business folks, but still kind of a pretty small subset of business folks using something like Tableau. And then on the other side of the communication equation, I guess, or more on the communication equation, you have PowerPoint and people who are using it to communicate. We feel like data storytelling is the bridge between data analysis and PowerPoint. And that bridge, there's not any tools in the market to cover that bridge. And so Flow is this data storytelling tool. It's a enterprise SaaS company, which means that we both have tools so that people can, with a subscription model, build their own data stories, but also we have a services component to help people do those.
[00:02:39.329] Kent Bye: Great, yeah. So I know that we had a chance to talk last year. And over the last year and a half or so, I know that I've run into and seen a variety of different demos of updates of the latest thing that you've been working on. And so you just had a chance to show me the latest stuff that you're working, which is actually kind of pivoting away from VR and moving into AR. So maybe you could give a bit more context as to this pivot that you've moved away from focusing so much on the immersive VR and focusing on the use case for AR.
[00:03:08.928] Jason Marsh: Yes, so the virtual reality industry has not grown as quickly as we all might have hoped. But also for our particular use case, certainly for in-person experiences, we found that the block out effect of virtual reality was too much of a barrier. And when you think about it, if you're trying to have a conversation with someone in VR, even if you're both in VR in a shared experience, If you're in the presence of someone, you tend to want to pull the headset off and see them. It's just a natural human thing to do. And of course, when you pull the headset off, we lose value, right? Our value should be as strong as possible throughout the interaction. As soon as you take similar content and put it onto an augmented reality headset, Suddenly people keep it on for 20, 30, 40 minutes for the whole meeting where they're still interacting with the content floating above the conference room table between them. Now that interaction really starts to make sense. And so while our technology certainly still works on VR headsets, and we'll continue to do that, we pretty much are talking about our flat screen solutions. Because remember, as I started this, I didn't say we were a virtual reality company. I said we were a communication company. So our flat screen solution and our augmented reality solution, we're working today on the Magic Leap. And when I say working, let me just also mention something that everything we do is based on the web. So we're using web VR, web AR, and just the web so that when we produce a piece of content or you produce a piece of content, it works on every flat screen. You get a killer website by default. And then you also get, if it's appropriate, the AR experience if you have the right device. Wow.
[00:05:08.186] Kent Bye: And I'm wondering if we could take a step back and you could tell me a bit more context as to your background and your journey into immersive technologies.
[00:05:16.328] Jason Marsh: So I shouldn't admit that I've been coding for 45 years. I started when I was very young. And my background has been in enterprise software through my career. I started at Apple Computer working on speech recognition. I did a company creating CD-ROMs back in the early multimedia days before the internet. I've done financial services. I've started a school, a Montessori school. I've done healthcare. And then the last four years, I've been focused on immersive technology.
[00:05:45.665] Kent Bye: And what was the point in which you decided to get into VR or immersive technologies in general?
[00:05:51.474] Jason Marsh: I had been in my healthcare startup for too long and it was time to move on. Company's still alive, but it was time to move on. So I've called myself a information architect for at least a dozen years. And some of that grew out of my work on the school because I wrote the curriculum for a kindergarten through eighth grade charter school based on Montessori method and project-based learning. I spent two years of my life doing that and it's still going 15 years later. That's still a going concern and doing well. But after I did that and then I came back to tech, I was really interested in how we build our mental models, how we organize information. Of course, that applied very cleanly to my user experience and UI design and coding, but also really to how you presented information to these enterprise customers. And I found myself in meetings with very senior healthcare executives where I could bring in through a few really key graphics. I call this visual thinking. I'm not alone in that. By using visual thinking and a few key visuals, suddenly people could understand better. what I was talking about, and I would get an incredible amount of credibility very quickly. And taking that idea and trying to bring it into this incredibly powerful mechanism of immersive media was my motivation for getting into virtual reality to begin with.
[00:07:25.657] Kent Bye: Yeah, I know that we talked about a year ago at the XR Strategy Conference, and then in the spring, the following spring, which would have been 2019, I came to San Francisco, I believe it was, for the Immersive Design Summit, and they had a party, and you were there showing the latest demo, and maybe you could talk a bit about what you were showing there at that gathering, because I want to sort of talk about my own experiences of that.
[00:07:50.820] Jason Marsh: I believe you saw the first version of BlackRock of our case. BlackRock is one of our largest customers and we've done three projects now for them. What's very interesting in that use case is we did a piece that had to do with brand sentiment data and essentially how BlackRock is using machine learning to help them make their decisions. It's basically a marketing slash training piece, really marketing education, which helps their own and third party strategists, their sales folk, to be able to help people understand what happens behind the scenes at BlackRock. So it's not a tool for BlackRock to make decisions. It's a way to explain the ways that BlackRock makes decisions. And the use case was actually pretty exciting, so they displayed it on great big screens in a very high-end venue event with lots of people. And then they passed out little Homido Mini Google Cardboard clip-ons so everybody in the audience could go to a URL, because it's web-based. Again, you would not be able to do that with an app. And we got a very high percentage, I think high 90 percentiles of people actually using it in the audience. clicking around in VR on their phones. And then we had big headsets to the side. And then the final piece was that everyone took home those Amido minis, and they could then use those. And they did additional trainings to get more people using Google Cardboard. We may think that Google Cardboard is a pretty sorry excuse for real VR or whatever. But when the content's kind of simple, It really seemed to work, and the client loved the fact that people were engaging so deeply with the content, which is very different than just sitting and watching the slide deck from the audience. They overcame that passive experience and created this much more engaged experience, and that was pretty exciting for them.
[00:09:49.656] Kent Bye: Yeah, it's been probably over six months since I've seen that now. I still have this spatial memory. And I don't remember the specific details of the story that you were telling, but I just remember you were showing different parts. I think it was Nike, where they would do the Colin Kaepernick add and then you were like actually this is not an anomalous event like they've done a series of at the time controversial topics but they always see like this burst in their sentiment for their brand and i remember you kind of walking through this history of specific events of like oh and this bump here is when this came out and it was like really like this history of like the story but it was being told through seeing this graph and for me to even remember the specifics of that like six months later it's like it stuck with me it's like and then there was other ways in which that you had all the brand sentiment lined up in a way that you could walk through it or see relative to each other and to see like the sentiment of different things as they're falling and rising over the course of like a year or something like that But just to see a spatialized version of the data gave me an architecture in the story that you were telling to be able to latch on to. And it sounds like that what I remember you telling me is that, you know, a lot of times they will get everybody together and, you know, try to show data on these two graphs. But to have everybody before they do the presentation to actually have their own embodied experience with the raw data. Then when they refer to it later, then they have their own experience that they're able to refer to based upon their spatialized experience of that, of their own discovery of that. So yeah, maybe you could talk about that process of trying to use VR or AR to be able to leverage that spatial memory and to be able to amplify different stories of data that customers are trying to tell.
[00:11:43.461] Jason Marsh: First, let me just say that it's absolutely freaking unbelievable that what is basically some pretty obscure financial information was able to stick with you for six months. And that's both to your credit, but maybe a little bit to the credit of the content and the medium. That's amazing. How many PowerPoints can you remember from six months ago? especially about something that really doesn't affect, I assume that you're not a financial investor and working in the stock market. It's pretty far divorced from your daily life, yet you're remembered that much. So that is a really nice proof point of the power of virtual reality and immersive media in general. I'm just going to expand on that a little bit more because we met with the CIO of the Active Equities Group at BlackRock. about a month after the event, a little bit more actually. And we started the meeting and said, first, just tell you what you remember of what you saw. And he could totally nail it. And he at first just said, oh, I saw this, that, and the other thing. And we said, yeah, well, just tell us a little bit more so we can understand. What was really exciting is he spent the next five to 10 minutes of this meeting. And of course, this is a high level important meeting for us as a company, right? He spent the next 10 minutes telling us why Flow was so important to his organization. The fact that what we did enables them to communicate their message in a way that differentiates them from their competitors. PowerPoint is the ultimate dumbed down technology. You take everything and you oversimplify, you turn things into bullet points so they lose this context and the meaning of the full sentence. You take PowerPoint and every time you put a slide a slide disappears and you go to the next slide, you have a cognitive break in your mental model. You have to rejigger. Now, how did that slide work with this slide? In terms of our 3D mental models, you lose the context and it makes it very hard to remember. PowerPoint actually violates the natural filing systems of our brain, which are in 3D. We understand things in 3D. That's the way we evolved. That's the way our brains work. So, whether we're working on a flat screen or in VR, we make sure that you maintain that context. Every time we go from one visualization to another, we move the dots. We animate from point to point. And a dot always means the same thing, or you try to make it mean the same thing as much as possible. A dot is a city or a dot is a point in time of brand sentiment in the BlackRock example. And you're seeing it in a variety of contexts and you extend the timeframe and you zoom in. All of those are really fundamental to communicating, as the CIO said, communicating deeply in a way that's credible, where you can see both the big picture, the forest, and the detail, which is the trees. So that's really the value of what we're accomplishing. And now to think about doing that, yes, on every flat screen with a nice scrolling interface, but also have that content floating on the conference room table between us, we feel like it's an enterprise use case that's really got legs and we're getting some really nice response from the community.
[00:15:03.544] Kent Bye: Yeah, as you were talking about the animation of those dots flowing around and animating from scene to scene, I also remembered that you showed me this graph of the cities and the size of the cities and to show how the biggest cities in the world, how they were concentrated in China. And just to see the relative size of some of those cities compared to around the world, you really get this sense of scale of having those over 2 billion people there in China. But these these mega cities. I went to the Qingdao back in years ago and to the Sandbox Festival by Eddie Lau. And it was like 10 million people were in the city. It wasn't even like a big city relative to China, but you're just driving from the airport and just seeing all of these huge towers. And so like I had that embodied experience, but then to see how those cities were kind of distributed throughout China was like, I just remember being like, wow, It was able to leverage my own direct experience, but also to remember and to spatially see things as well. Like you were saying, once you are able to see information relative in that 3D space, it's more memorable, but especially when you start to geolocate some of that information. And that was the other thing that I think that was really powerful with that experience in particular was that you start to then tie that to those GPSs so that you can see the globe and then overlay all that data and information over the world, which I think for me, I feel like the world becomes like this memory palace where we have these actual experiences, but with tools like this, with Flow Immersive, you're able to then overlay on top of that all of these data visualizations to give you all this additional context of that point in space and time.
[00:16:46.943] Jason Marsh: And the context, yes, seeing things from different angles. One of those angles is the drilling. We call it scale zoom, where you click on a dot and the world expands or the content you're looking at expands around you and you see new data, little micro data inside of what was that dot. It could be something where you step into a 360 photo when you click on a city. That was probably the example you saw. But in the Colin Kaepernick example, which you remembered from BlackRock, you actually click on a dot and suddenly it explodes out into a word cloud of the words that were being communicated on Twitter, you know, sized based on the content. And when you step into a dot, that's that forest or the branch or the leaf. That's what gives you that credibility and understanding in a very different way than the static bar charts that people are used to putting in PowerPoint. Oh, my God. It's just so many... problems with the way you have to trick your brain into giving those bar charts meaning and cognitive value. And we try to use brain science to overcome all of that. Maybe what I'm communicating is I want you to understand how different this is than just saying, oh, we're going to take some data and put it in 3D and think that it's going to be more valuable than that. It may be. It may be. And there's some really good companies doing really good data visualization work, data analysis tools in VR. But we're actually in a very different space. There's a different end user base for us than data visualization tools. It's sales. It's where you need to communicate and effectively persuade someone. It's, I'm communicating to management, to your management, so you can have good, effective board meetings and make good data-driven decisions. It's consultants working with customers to understand what that consultant discovered in all of the probably very expensive work they did to analyze some problem within their organization. So the end user is a much broader end user, and it actually feels like a very different use case than just a data visualization analysis. I think you're really hitting on it and seeing the way that the data comes alive and has meaningfulness in a different way than we're used to when we're used to thinking about data visualization.
[00:19:13.208] Kent Bye: Yeah, one of the things that I enjoyed about the VR version that you had was that because you have the hand-track controllers, I feel like you're able to maybe interact or play with the data in a little bit more interactive way. I think you're a little bit more limited when you have something like the Magic Leap Pointer, which, you know, it's Six Degree of Freedom-esque. You know, it's kind of like not... I don't know. It feels like I don't feel like I have a full embodiment and able to really get my hands onto the data in quite the same way as I can in VR. And I know that I had talked to different people from the realm of data visualization, information visualization from the more academic VR community. And their comment was that a lot of the data visualization people that are typically coming from more of the 2D realm, they were highly skeptical of the benefit of VR because from their perspective you have all these issues of occlusion and you're losing some of the power even with one of the visualizations that you were showing to me it was a little bit lower and so I had to try to like line up and you know they have like these different parallax effects but you know sometimes if you are doing different data visualizations and you're looking at it from a skewed angle, then you see a skewed version of the data. And so I can see and be sympathetic to that perspective of someone coming from the 2D visualization being skeptical that you're going to be losing some stuff when it comes to the data visualization. I feel like you're gaining the spatial architecture of your brain, but also potentially the interactive component, which is, I think, a big part of what I've seen as the big power, which is to be able to dynamically either you directly engage or to see it animate over time so that it's going from one context to the next. And for me, there's that dynamic motion part of it that I think can overcome some of those fears of the occlusion issues of someone who's only looking at through the tradition of looking at 2D plots.
[00:21:08.317] Jason Marsh: The animation is absolutely key. I think because how things move is even more important than sizing the dots. You can think, oh, there's so many different ways of looking at data. Well, time is a really valuable way, and it's one that we all intuitively understand. So how you animate and move is very important. In terms of interactivity, yes, I do think that a single controller, a point and click, is a little bit limiting compared to where it's going to end up. Obviously, we're looking forward to and exploring the freehand interactions because I think that imagine sitting around that conference room table with the C-suite. You don't want anybody to have to learn how to use a device, a controller, anything like that. They're just going to want to reach out and grab stuff. And, of course, there's some good technology already on the market for that. It's not quite as far as long as some of them would purport it to be, but I think that that is going to work in the future, and that's where it will end up.
[00:22:14.113] Kent Bye: Yeah, maybe you could just give a bit more context as to the tech stack that you used in order to build this, because you are using this on the open web. Like, what type of tools did you use to be able to create it?
[00:22:24.739] Jason Marsh: Yeah, so it's a JavaScript stack. So we built on top of 3JS, which is an open source library. We also brought in chunks of D3, which is an open source data visualization library. Obviously, all the rendering part of D3 doesn't apply because we're rendering into 3D space. And we've actually built a lot. We've built an entire authoring tool, which is using Vue.js. I'm just really happy with that decision. On the backend, it's a Node.js system. Of course, we run everything in the cloud. We happen to be using AWS at the moment for all the backend side of this. But to be able to build Yeah, we've put some energy into this. I mean, this is probably about eight man years of coding at this point with the team's efforts. And so to build the full 3D visualization system and an authoring tool, as well as backend security, because this is an enterprise tool, and, you know, sharing and publishing and all those capabilities. Feels like a pretty significant amount of work. When people, very often we do a demo of the flow editor, we call it the two-minute demo, which takes about four. But our two-minute demo, and we start from scratch, upload some data and hit the publish button. And then we have people grab their phone and see it on their own phones. And we always get this nice little rush of like, wow, that just happened? It's fun. So pretty proud of our tech stack and it's pretty extensive.
[00:23:55.719] Kent Bye: Yeah, and I know that just recently you sent out a tweet that had a data visualization that was actually viewable through the web browser where you could send out a tweet, you have a URL, then you go to there, and then you're kind of like scrolling up, but as you're scrolling up, it's sort of animating through this whole data visualization of some of the messages from Andrew Yang talking about these different kind of I guess maybe you could explain what inspired you to take something that was coming from one of the potential Democratic nominees for the presidential election of U.S. election 2020. We're having all these debates, so maybe you could talk a bit about the context for you to take some of the information that was being talked about, but then why you felt that that would be a good translation to be able to visualize within 3D.
[00:24:40.851] Jason Marsh: So I'll give credit to build the whole thing. Michael DiPanino built that entirely in the Flow editor. In fact, all of our projects now are being built in the editor. We're not having to do custom code. So one of his motivations was that Andrew Yang really talks in terms of a data story. He's focused on how the loss of manufacturing in the US led directly to the economic malaise in states that specifically swung to now President Trump in the last election. and saying that the core issue we need to understand this loss of manufacturing jobs, how that happened and get ready for a future where they're not coming back because of automation. It's not a matter, in his case he's saying it's not a matter of tariffs, it's not a matter of immigration, it's just technology and manufacturing and a lot of other jobs are going to go the same way as manufacturing. We better get ready for the new world. So the fun thing about this scrolling tech is that it's a very linear story. And the end user doesn't have that much control. I mean, they're just scrolling, swiping up on their phones, scrolling the same way we all know how. But then to see the world of data or content, graphics move and spin and animate. Sometimes a data visualization explodes from one state to another state as it's looking at it from a different perspective. And you just have that very gratifying feeling of being in control because I'm waving my finger up and down as I talk to you. It gives you that sense of mastery and control through a very simple interface. There's something really delightful about that and we're getting such good response to people when we show that. whether it's a story about Andrew Yang or life expectancy or cathedrals. We're working on a piece on cathedrals right now. It was a very different content. You still get that, oh, I'm in control, delightful feeling.
[00:26:42.011] Kent Bye: Yeah, I remember one of the first demos that you showed me back at GDC 2018 was this text of Hamlet, where you were actually working on a lot of text rendering. And so maybe you could talk a bit about the state of rendering text on the web, and then what you had to do to make it look a lot better.
[00:27:00.885] Jason Marsh: Your memory is astounding. Or VR is astounding, or both. So credit where all of it is due. So one of the things we built early on, in fact, it was the first tech thing I built when I started working in VR, was to build a really great text engine. Because text has been so hard to do in VR. And so our text engine running on the web can take Shakespeare's longest play, Hamlet, which has 147,000 characters, and render it all in 3D space in real time on an iPhone 7 at 60 frames a second without glitching. So the goal for that, of course, we still use the text engine and have continued to take things like put entire books into 3D space. But really, I think why that's important to us as a company is if you look at some of our stuff and go, oh, that's data visualization. And I would say, yeah, it is data visualization, but it goes back to this idea about communication. Why shouldn't we be able to work with massive amounts of text and organize it in a way that suddenly becomes meaningful, that is unique than any way we've ever been able to experience it before? And so we're not just throwing dots and triangles and rectangles into space. We also can throw ideas and arrange ideas in space. And that was the exercise with Hamlet. And you can still do that entirely in the tool, actually.
[00:28:32.455] Kent Bye: Yeah, I guess one of the frontiers that I'm looking forward to is to figure out how to break out of the 2D frame. Because I feel like a lot of the graphs I've seen still have a plane element to it. Like, what is a 3D graph that really uses, to the full extent, the 360-degree space? I guess the mathematical approach that I think of is something like topological data analysis that's able to then really turn how information is related to each other into a physical space. And a lot of machine learning of the higher dimension and pseudo-Riemannian geometries, whatever they end up using to be able to have these higher order relationships between the features, but then it has to be projected down into 3D. But once you project it down to 3D, you're able to potentially find either through space or in coloring or any number of ways of adding additional information into that context, then you're able to discover clusters of information of how they're related to each other. Just curious if that's something that you've started to look into as well of some of these other mathematical techniques to be able to use the full spatial affordances of VR to be able to gain even more additional insight.
[00:29:45.718] Jason Marsh: Yes and no. Okay, so we've certainly done some interesting experiments, but remember, we're not trying to push the boundaries of scientific exploration. We're pushing the boundaries of communication. And so when we present some data or you build some data in our tools, that lays out the content in 3D, in particular, I think you're talking about new ways, you know? And for us, the idea that it's new is to delight the user. It's to, yes, explain it, but also to entertain, right? We're not trying to push the boundaries of scientific analysis. There's other companies who are doing very well with that, and we appreciate the work they're doing there.
[00:30:27.950] Kent Bye: Well, just even I think there's going to be elements like, let's say, sonification or adding sound to things where I think you can do both. I think that sometimes there are things where you could add things that does actually give more analytic insight as you added, but it also can give a whole experiential multimodal input of having additional ways of translating data into either sound or color or music or other things like that. So I'm just curious if you've looked into sonification or other ways to increase the number of modalities that you're leveraging?
[00:31:01.765] Jason Marsh: Really love the idea and in our case so much of what we're doing there's a live spoken live person communicating as well as the visuals and in that case you want any audio cues to be very subtle and very soft because you don't want to get in the way of the person who's trying to talk to you and So I do have an example where sound was very, very important. So I did an art piece. It's actually currently in a gallery in San Francisco. My first VR art installation, which was basically relating to the Paradise Fires. It's called the Camp Fire, and in Paradise, California, a year ago, almost exactly a year ago, in November of 2018, there was 88 deaths in a horrendous fire. Thousands of homes were burned in a very short period of time. What I did as an art piece was take Dante's Inferno, it's a mashup of Dante's Inferno, IPCC global climate change data and text and audio from drivers in their cars escaping the campfire. So I just pulled the audio from YouTube, give credit where it's due. So the audio was this mix of narration from, you know, classic narration of, you know, 800 years ago. How long ago? 600 years ago, where Dante Alighieri seeing a forest on fire. And then the IPCC climate change folks saying, hey, this is coming. And then you actually hear the reality of what disaster feels like, a climate change related event disaster feels like. And the audio is very powerful. It's a nice four minute piece that stands on its own and actually could not have narration, right? And then you see the dots are actually forming data visualizations, but they're also kind of animating around and flying around like they're embers being blown by the wind. It's a pretty fun little piece, and I love the way the audio integrated to that. But again, that was a very emotional piece as opposed to a scientific piece. And I have a master's in music composition. I would love to spend more time working on the sonification, so maybe you'll inspire me to do that. But the actual use cases of the Enterprise, the audio has not been a key part of it.
[00:33:28.823] Kent Bye: Yeah, it just reminds me of Al Gore and Inconvenient Truth and him trying to take the data in his own way, try to translate that into a narrative and a story to get the message out there. And then, you know, there's a sequel that came out just a couple of years ago as well, but...
[00:33:44.524] Jason Marsh: I'm going to interrupt you because Inconvenient Truth, that presentation was put together by a gal named Nancy Duarte, who started a firm to do presentations. She now has something like 200 designers. doing presentations. You obviously have seen her work if you've been to any big tech conference for all the CEOs when they give their keynotes and all of those things. And her latest book out last month is called Data Story. She is so focused on data storytelling. So we're not alone in this space. So Inconvenient Truths was in a way a watershed moment. The moment from that where Al Gore has to get on a lift to go up onto the screen and say, look at where the carbon is today. That is showmanship of scientific information to its ultimate, maybe perfect degree.
[00:34:41.769] Kent Bye: Well, yeah, and I think that there is this crisis in the world. And in some ways, I feel like it is, in some sense, a crisis of consciousness of not having the ability to connect the dots between behaviors and the impact on the larger ecosystem. And the thing, I guess, that gives me hope is things like virtual reality as a medium that may find these new ways of adding complexity into something that is already an actual, very complex, nonlinear system, and that we have these embodied metaphors of where we have this understanding of things and i feel like that there's something about these data stories that may be able to get at these larger ecosystem dynamics these processes that are unfolding that may allow us to get this glimpse especially if we're able to interact and see how our agency is able to maybe have these different iterations of what outcomes may come based upon if you're able to tweak the variables but these very complex nonlinear systems that are unfolding in these processes, like that's difficult to reduce down into a single dot or a single 2D plane or a single sentence even. And so having the medium of VR, I feel like is going to potentially open up all these new possibilities for us to just have these deeper understandings about the nature of the world.
[00:35:56.758] Jason Marsh: I really believe that what Flow is trying to do is help humanity communicate better so we can solve the biggest problems we need to solve. It's a big picture vision, and I think that we can do it.
[00:36:09.293] Kent Bye: Right. And so for you, what are some of the either biggest open questions you're trying to answer or open problems you're trying to solve?
[00:36:18.542] Jason Marsh: I think the most, to completely change gears, it's really how do these use cases get to be everyday experience and that the immersive, the spatial computing industry gets itself on a very firm footing moving forward. Obviously, there's going to be some really great use cases in training and a variety of really exciting possibilities, but always the startup process is exciting and interesting and challenging and moving this tech and our current successes into a much broader application to consulting to the enterprise as a whole. That's the big challenge and that's what we're... We spend a lot of time thinking about that as much as just building the tech and doing the artistic expression.
[00:37:09.228] Kent Bye: And finally, what do you think the ultimate potential of spatial computing might be and what it might be able to enable?
[00:37:17.709] Jason Marsh: Like I say, just to change the world. I mean, that's what we're about. I mean, I think that if you think about how we've gotten to a point where we talk at each other and not listen, we no longer can tell a story, certainly like in a political context, tell a story and have people believe you. We no longer have the sense of credibility in our public communications, at least in the U.S. We're really losing a lot of that. And I think data storytelling is the only solution that I know of that would enable us to reestablish that credibility at the same time we maintain the empathy. And that's the heart and mind, you know, classic conversation. But I think this is the way we solve the big picture problems. And spatial computing is a key aspect of that.
[00:38:06.491] Kent Bye: I was just recently looking at some of these bad design graphs where they may put zero top and then, you know, have something happen so that it looks like it's going down, but it's actually going up. Have you thought about the potential, you know, kind of red teaming of this to be able to abuse this type of data storytelling, to tell stories that are skewed based upon the specialization of it, where it's a powerful story, but it's actually trying to manipulate people and skew the data and evidence in some way?
[00:38:34.838] Jason Marsh: all powerful technologies have powerful could have powerful negative consequences in the wrong hands i remember um giving a be i was on a panel at a education and tech conference and this was educators mostly um elementary yeah elementary through high school educators And the level of anti, as a question started around the room, the level of anti-technology was so severe, you know, just how phones have destroyed our minds and the kids are, you know, and it just went on and on. And I was just struck by, it felt like people had forgotten that we have almost all of the world's information sitting in our pocket at all times now. What an amazing technology that is. And yes, it may be destroying our sense of personal self because of Facebook algorithms or just the monoculture of algorithms that get us all to think the same way or all think in our own little echo chambers or whatever. There's something really tragic going on there. But at the same time, the wheel, I mean, I could say that the wheel was a horrible invention. If you're a tribe in Roman times and suddenly these chariots come marching through your space and they're so destructive because they have the wheel and you haven't been using a wheel yet. Yeah, the wheel is a horrible technology. Oh my God, why would we, we have to stop the wheel. So unfortunately, I think that if you've got a powerful communication system, you might be able to twist that for evil. Some people have certainly said that you can make, you know, statistics can lie very, very easily. But I do think that how we use technology, it's our responsibility. And we need to not be afraid of moving forward because it could be dangerous as long as we try to build as many systems to protect that as possible within the base technology.
[00:40:39.010] Kent Bye: Is there anything else that's left unsaid that you'd like to say to the immersive community?
[00:40:44.719] Jason Marsh: Fortitude, power forward, continue to make it happen. Whether it goes up or down, it's going to happen. So it's fortitude to everyone.
[00:40:54.184] Kent Bye: Awesome. Well, Jason, I just wanted to thank you for sitting down and talking to me. And this is an area that I'm personally very interested in and see where it goes. I think it's very powerful. And I'm excited to see where you take Flowmersive and where the larger industry as a whole starts to use more data to tell stories. So thank you. Thank you. Thanks again for listening to this episode of the voices of your podcast. And if you enjoy the podcast and please do spread the word, tell your friends and consider becoming a member of the Patreon. This is a, this is part of podcast. And so I do rely upon donations from people like yourself in order to continue to bring this coverage. So you can become a member and donate today at patreon.com slash voices of VR. Thanks for listening.