 Eric Greenbaum was at a New York Virtual Reality Meetup when someone from the financial industry came up to him with some ideas for how to use VR to analyze stock market data. They decided to collaborate on QuantVR and develop a prototype demo of a stock market platform and data visualization tool that was shown at the Silicon Valley Virtual Reality Expo this spring.
Greenbaum’s business partner has a lot of experience within the financial industry, and they’ve using that insight to create different 3D visualizations of financial data in order see patterns within the data. They created a Ticker Tube view that fills up your entire field of view in VR with data from 300-400 stocks, but they believe that VR has the potential to go beyond just adding a lot more screen real estate for 2D data. They believe that 3D immersion has the potential to unlock new insights and democratize financial analysis that make the market even more competitive by smaller players.
Greenbaum’s business partner says that automated trading algorithms account for as much of 70% of the volume of trading, but that a lot of these automation tools have been developed in the absence of visualization tools. QuantVR is able to slow down and visualize the millions of transactions and actions that happen over a course of a second, which allows them to gain insight into how dumb some of these trading robot algorithms can be sometimes. Again, discovering these types of inefficiencies can translate into real dollars by finding a way to be more efficient.
Technology has disrupted the financial industry, and there’s been a lot of complexity introduced that has created a lot of fear due to that lack of understanding. So not only can there be applications for financial companies, but also for the government in order to improve their understanding and oversight of what’s happening.
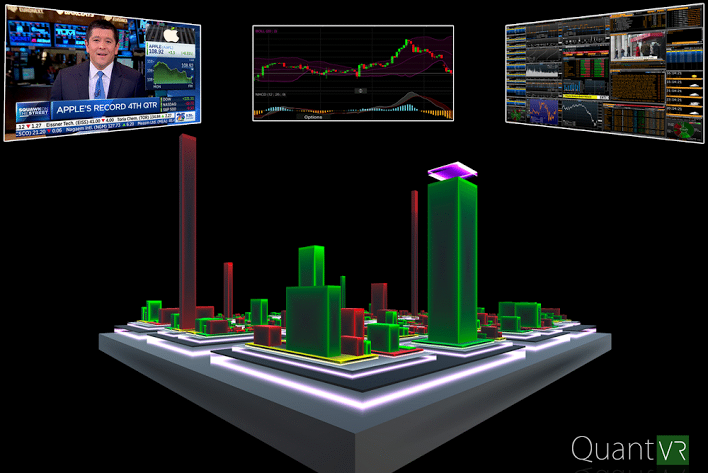
One of the 3D visualizations that QuantVR created is the Stockscape view, which shows the market capitalization of the highest traded stocks as a city-scale landscape. You can hover around to the tops of different buildings representing the market cap size, and look around to compare the relative sizes from within an immersive environment. Scale is something that QuantVR has been experimenting with, and it’s still a bit of an open question as to whether having a city-scale or miniaturized-scale is more efficient.
Stocks move to common risk factors and so QuantVR has created different logical groupings of stocks to be able to watch trends of how those stocks are changing over the course of the day. There haven’t been a lot of 3D visualization tools, and so most of the financial analytic approaches have defaulted to a 2D representations.
QuantVR believes in the power of exploring what 3D has to add to analyzing data, and if they’re able to gain new insight into the market, then that could easily translate to having a competitive advantage in generating revenue for clients.
They’re actively beta testing their product with a high-profile client, but it seems as though the financial companies are going to be pretty tight-lipped about how these new immersive technologies might provide them with any specific competitive advantages.
Will 3D data visualization tools be the future of financial analysis? Or are there too many inefficiencies with the occlusion issues that are introduced into data visualization? That’s yet to be seen and QuantVR is on the forefront of exploring these issues. Yet I’d don’t honestly expect to get a lot of answers to these questions from Wall Street considering how much money could be at stake given what those answers might be.
The VR data visualization academics that I talked with at IEEE VR believe in the promise of 3D data visualization and analysis, but it’s usually data that is tied to actual 3D geometries — like correlating earthquake data onto a map of the earth. So the benefits of abstract data visualization with an immersive 3D environment are not immediately clear. Sometimes 2D charts and graphs are actually far superior and more efficient than trying to view the same data within a 3D context.
However, one thing that the academics agreed upon is that data that has a time dimension has a more clear use case for representing that change over time on the Z-axis. So stock market data certainly has a lot of potential for how that time data could be represented within VR.
Finally, QuantVR does sees that VR has the potential to democratize data analysis within the financial markets beyond the few, very elite quantitative masterminds. Their goal is to break down complex problems into a symbolic representation in an immersive environment that becomes intuitive for a user to understand a fuller spectrum of the dynamics of the marketplace. They hope that it’s going to make the market more competitive and ultimately better for all investors, and they’re looking forward to help making that happen with the power of VR.
Become a Patron! Support The Voices of VR Podcast Patreon
Theme music: “Fatality” by Tigoolio
Subscribe to the Voices of VR podcast.
Rough Transcript
[00:00:05.452] Kent Bye: The Voices of VR Podcast.
[00:00:12.035] Eric Greenbaum: I'm Eric Greenbaum. I'm the founder of the New York VR Meetup, and I'm here to talk about my new company, QuantVR. We are a stock market trading platform and data visualization tool for virtual reality.
[00:00:23.401] Kent Bye: Great. So maybe you could talk a bit about how this project came about.
[00:00:27.817] Eric Greenbaum: I run the New York VR Meetup. A few months ago a guy comes up to me, my co-founder who's here with me today, says that he's in finance and he has some ideas for using virtual reality for financial applications. I come to understand that he is very deeply involved in finance and is a true expert in the financial markets. So we started to talk about what those opportunities were. And data visualization kind of comes to the fore in the sense that virtual reality and 3D visualizations generally really give a really unique way to understand financial markets. They are super information dense and it allows users to kind of see everything really clearly and make informed decisions based on intuition.
[00:01:09.265] Kent Bye: And so, yeah, maybe this is a question in terms of the typical person tracking the stock market may have what I presume are Bloomberg terminals with lots of data there. And I've seen one article that I think maybe Bloomberg put out that said that VR could have the potential to kind of put many screens within your field of view. Is that part of it, as well, as just sort of having all the information available that can go beyond just 2D?
[00:01:36.976] Eric Greenbaum: Yeah, I mean, absolutely. So kind of at the first level, when you're in VR, you are not limited by real-world constraints like desk space or how high can you stack computer monitors. So if you're looking to have just 100 monitors in your field of view, that's possible. We've built a demo. We call it TickerTube to display information like that. We do think, however, that the actual 3D data visualizations add more value for the user and communicate information in a better way.
[00:02:06.171] Kent Bye: And can you speak to a little bit in terms of the decision-making process of looking at stuff in 2D versus 3D and how the 3D immersive nature of it kind of changes that process of giving you more insight?
[00:02:20.265] Eric Greenbaum: Sure, so in our demo for Stockscape, for instance, you're able to visualize 2,000 securities at once, simultaneously. The reality is that while there may be 2,000 to 3,000 active stocks trading in the U.S. market on a daily basis, there's not 2,000 to 3,000 degrees of freedom governing how those stocks move. In fact, stocks move in response to common factors and common risk factors, such as what sector is the stock in, what industry is the stock in. You know, if the internet got banned tomorrow, tech stocks would probably do pretty poorly, but maybe some material stocks or maybe some other industrial stocks may not be hit as hard because they're sensitive to different risk factors. So, by basically building a landscape from the ground up, it allows us to group these securities into logical groupings in such a way that you can very quickly identify What grouping you're looking at and be able to see whatever market factors you're trying to understand in real time? Changing at the same time you're able to observe the entire distribution of what the landscape looks like so a lot of finances crippled by false notions that things follow normal distributions and you know that that applies to all forms of data and By being able to visualize the entire data set in its entirety You get a better context and a better perception of where there may be opportunities for trading
[00:03:37.152] Kent Bye: Yeah, so it sounds like the 2D screen representation of all that data is just too overwhelming to navigate. But yet, in a 3D world, you are able to kind of give these little indications of the changes to be able to use the skill of the human brain to do pattern matching, is what it kind of sounds like.
[00:03:53.709] Eric Greenbaum: Yeah, so human perception is much more evolved towards three dimensions. We have constrained ourselves in training to two dimensions for hundreds and hundreds of years because the availability of three-dimensional visualizations was highly limited and impractical until very recently. But all of our training, all of our nonlinear internal machine learning that taught us to detect whether there was a tiger around the corner or if there was danger coming, all those perceptive qualities that have been innately developed in us over the years have been done so in an immersive three-dimensional environment and it just seems like that area is absolutely ripe for the picking in financial analytics.
[00:04:31.883] Kent Bye: Wow, and I've talked to a little bit of different academics in the IEEE VR, so they're looking at, from the perspective of VR, but they've been talking to different information visualization specialists, and they're usually pretty skeptical of 3D due to different occlusion issues that may happen. But the one thing they did say is that the time dimension is something that is pretty compelling use case in terms of seeing how data is changing over time. So I think this is an area where it's pretty clear use case in terms of stocks and how they're changing over time. And so I guess, how have you started to use the third dimension of depth in order to kind of show these trends of whether things are kind of increasing or decreasing in any given moment?
[00:05:12.836] Eric Greenbaum: You know, it's not just depth, it's the concept of animation. It's the concept that your graphical elements that are representing features in the data, there's no reason for them to be static. And if you're in an immersive environment, they don't have to be. So, you know, I can look at one metric and then fast forward through time and watch that metric evolve through a time scale that I define, whether it be artificial or it could be in real time or It could be in slowed down time or it could be in sped up time. And I can watch that and aggregate across many, many stocks, across whatever dimensions I plot. We have colors, we have textures, we have this whole immersive environment of visual cues that we can use to analyze and detect patterns in the data.
[00:05:53.350] Kent Bye: Yeah, and it seems like there's been this whole trend in the stock market towards automation and automatic trading and more and more being run by robots. And something like this, it seems like it's almost impossible to have a robot do the same thing that a human can do. And that the humans still haven't gone away in this whole equation of being part of making these decisions. But it seems like a long way away from having a robot do something very similar from what you're able to do within this system.
[00:06:21.571] Eric Greenbaum: Well, behind the robots are people. The robots don't ultimately decide to buy and sell securities. People do. Investors do in response to their desire to have a highly performant portfolio. The robots are really interesting right now because they've been developed in the complete absence of visualization. So when we slow down time and look at things from the perspective of the robot, we see all kinds of things that no one's ever seen before. We're able to visualize microseconds and slow down time by a factor of a million, you know, and really through not just visualizations, but through analytics and visualizations, detect how these robots are performing. And a lot of them are pretty stupid, you know, like you might see the equivalent of a robot who stands up and runs into a wall, you know, drops his ball, goes back, picks it up and runs back into the wall, drops his ball. You know, that's manifested in, you know, some behavior where you might see an order continuously get cancelled in the marketplace and reinserted and cancelled in the marketplace. Because the algorithms have been developed in the absence of visualization and you know, these are complex physical systems There's 11 different equity exchanges in the United States. There's 60 alternative exchanges So upwards of 70 different places from the moment you decide to buy your stock There's up to 70 different places that your broker can actually execute that for you and they all work at the same time and it's a very complex system and there's a huge industry of banks and prop shops and brokers and hedge funds and retailers who were trying to navigate that space to the best benefit of their clients with a varying spectrum of success. So it's a really interesting time to be looking at this from a perspective of, well, you know what, I actually want to see what it would look like to a computer.
[00:08:02.544] Kent Bye: That's pretty fascinating to be able to slip that I mean you think about how much is happening in those one seconds and that you know We may not necessarily realize all the different computer mediated decisions that are being made and to be able to Actually visualize those in a way second by second. I think that's something that's really interesting and compelling to be able to actually see how the errors that you've not ever been able to have any insight into just because the data was just so overwhelming. And so, yeah, in some ways it seems like there'd be a pass of like really fine-tuning a lot of those algorithms based upon some of these visualizations.
[00:08:37.232] Eric Greenbaum: Yeah, there's tremendous value to be gained from examining that. And in virtual reality, you have the ability to drop yourself into that algorithm's world and see things the way that algorithm sees things, but from a perspective that a human being can relate to. So we represent orders by objects. And the way they queue up at different price levels, they just queue up at different price levels. And we run different types of particle animations to show different actions being enacted on by these orders. And you can see trades. zooming through the sky and so you really get a sense of what it's like to be inside of one of these matching engines and sort of get a feel for how much data they have to process and how they all have to stay in sync with each other. And how that in turn can lead to these corner cases where the robot is just walking right into the wall and dropping his ball. I mean, that happens. And the great thing about finance is when you find these things, it's usually an opportunity to generate revenue for your clients. And so not only are these highly fascinating, beautiful visualizations, but you know, they can be incredibly valuable.
[00:09:37.447] Kent Bye: Wow, that's really fascinating. And have you built a prototype to the point where you're actually able to use it in your day-to-day work of executing and making decisions in the financial markets?
[00:09:46.964] Eric Greenbaum: We're quite close. We're quite close. We have a very well-known beta client who's very close to adapting it in their workflow. Can't really talk more about it than that, but certainly a lot of these problems have plagued regulators and practitioners in the field for years because it's so complicated to understand. When you think about how much information goes to the stock market in a day, there's a billion records that are relevant. just for the American stock market. So to be able to comb through those and find, you know, a meaningful action and understand what that meaningful action was and find meaningless actions that were either careless or maybe there's some intent behind them or whatever, to be able to understand that and to be able to regulate and police that makes the markets a safer place. You know, technology came about so quickly and disrupted so much of the trading paradigm that now 70% of all the trading is done algorithmically. And it's got a lot of people scared and panicked. And they're scared and panicked because they don't understand it. And, you know, we've went through these weird resonant periods like the flash crash that cause everyone to question the stability of the marketplace. And when things happen on a microsecond to a human being, trying to understand that, they're practically invisible. So that lack of understanding and the lack of ability to communicate in a logical way regarding the dynamics that you're observing leads to a lot of finger pointing, a lot of fear mongering, you know, genuine concern, but very difficult to communicate and productively address those concerns and find the areas that would require reform and areas that, you know, may actually be really good and really innovative. I mean, you know, Markets are more liquid now than they've ever been before. So a lot of these fears are coming from the inability to really visualize and understand what's going on.
[00:11:31.558] Kent Bye: Yeah, and just also hearing all this just reinforces the impact of virtuality that is going to have on all dimensions of society. And especially the data visualization, I think, is particularly interesting, especially because a lot of the information visualization, data visualization that I've seen in VR, at least, has been connected to a 3D object or a world or something that's been the easy use case to take a building and look at different data attached to things in 3D space. You're really talking about using the abstract visualizations to make informed decisions. What kind of VR design decisions or insights have you had in the process of looking at abstract data visualization in the context of VR?
[00:12:12.164] Eric Greenbaum: It's kind of an interesting question and it's not necessarily something that we have a real definite answer to, but scale is a really important question, right? So when you're talking about a data visualization to look at all the stocks on a particular exchange, does it make more sense to have a city scale visualizations that you can walk through or fly through? Or does it make more sense to have kind of a miniaturized version that you can kind of manipulate and pick up and turn around and look at that way? We think there are probably use cases for both. And it's just a matter of understanding what works best and what resonates the best with our customers.
[00:12:45.244] Kent Bye: So yeah, this is probably one of the more mind-blowing type of applications of VR that I've heard in a while. And I'm curious what your intention is to be here at SAVRCon and reveal something that could potentially have competitors come in and swoop in and do the same. But it sounds like you're pretty far along and pretty confident in your approach. But I'm just curious about what you're trying to get out of being here at SAVRCon and showing people what you've been up to.
[00:13:07.435] Eric Greenbaum: Well, we wanted to get feedback from VR users, people that know VR the best. We're really interested in input, right? We want to figure out an input mechanism that is most intuitive and easiest for people to use. Maybe people that aren't really hardcore gamers and people that don't necessarily follow all the ups and downs and developments in the VR community. So that's been a big part of our trip here. And just to kind of see what everyone else is doing, look at the way games are being presented, look at kind of gamification and interaction elements and see how we can incorporate that into our products.
[00:13:36.700] Kent Bye: Great. And finally, what do you each see as kind of the ultimate potential of VR and what it might be able to enable?
[00:13:43.945] Eric Greenbaum: Well, in finance, I think it's going to democratize the role of information and understanding by virtue of new visualizations that help more than just a few elite quantitative masterminds like figure out what's going on in the world and really Once you break down these complex problems and you use all the tools at your disposal, some of these very complicated problems become simple to understand because you can make them intuitive. You can translate them into a world that a human being can feel comfortable in. And then once they're comfortable in it, when something goes wrong, you can immediately notice that. And so once you understand how the dynamics of the system work, by sort of being in a parallel paradigm that you feel intuitively comfortable in, be it a virtual reality world, even though we're not really using detailed textures or anything like that, we're really trying to focus on utilitarian geometric shapes to represent things that we can easily understand and not try to be decorative about it. But I think that that understanding shouldn't be locked away to the few who can actually visualize it in their head, who have the time and the resources to be able to do that. I think that that's going to make it really interesting, because the more people who understand the markets, the more competitive the markets become. I think ultimately that becomes better for all investors. I mean, all that is absolutely true. And the thing that kind of gets me super excited is being able to kind of in a tactile way interact with data. It's not just something that exists on a screen. It's something that you can reach out and touch and move and stretch and interact with in a way that is comfortable and intuitive. So the more that we can enable people to be comfortable with data and let them interact with it in natural ways, I think it's going to, like my partner said, democratize finance and open it up into a whole new world of people that maybe haven't been psyched to explore it before. So if we can do that, I think we've won.
[00:15:27.578] Kent Bye: Awesome. Anything else that's left unsaid you guys want to say?
[00:15:30.579] Eric Greenbaum: You could follow us at QuantVR or at www.quantvr.com.
[00:15:35.985] Kent Bye: Great. Thanks so much.
[00:15:36.986] Eric Greenbaum: Appreciate it.
[00:15:38.828] Kent Bye: And thank you for listening. If you'd like to support the Voices of VR podcast, then please consider becoming a patron at patreon.com slash Voices of VR.